Multi Area Chart Maker
The Area Chart Maker tool is a simple yet powerful solution for creating clear and visually appealing area charts. It highlights data trends, comparisons, and proportions, making it useful for reports, presentations, and learning.
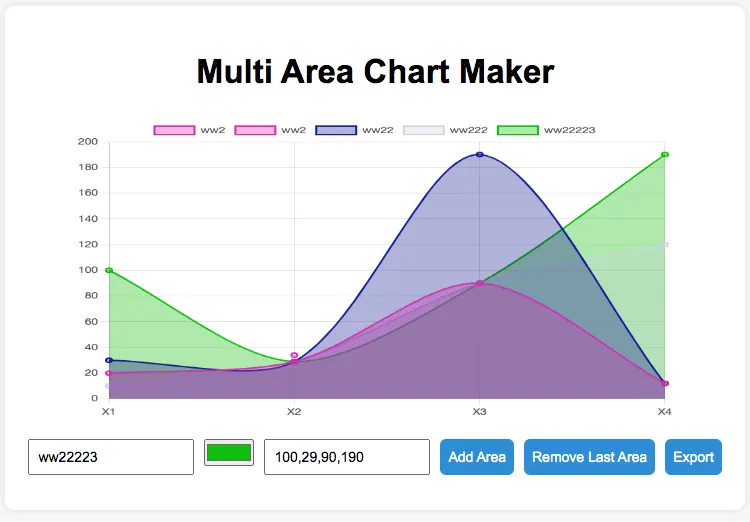
Multi Area Chart Maker
The Area Chart Maker tool is a simple yet powerful solution for creating clear and visually appealing area charts. It highlights data trends, comparisons, and proportions, making it useful for reports, presentations, and learning.
How It Works
- When you open the page, a chart with three default areas appears.
- Below the chart, there is a dropdown menu to select the area you want to edit.
- When you select an area, its title, color, and data fields are automatically filled.
- You can edit the title, color, or data (enter values separated by commas, e.g., 10,20,30).
- Click the "Edit Area" button to update the chart immediately.
- You can add a new area using the "Add Area" button.
- You can remove the last area using the "Remove Last Area" button.
- To download the chart as an image, click the "Export" button.